Dataista is a new Chilean company that designs data visualizations and publishes its own data stories on its platform, dataista.cl. Publishing stories regularly called for visual consistency across the site, so that each new story could build on a shared system instead of rethinking every design decision from scratch. I created both the company’s visual identity and its data visualization guidelines with that goal in mind.
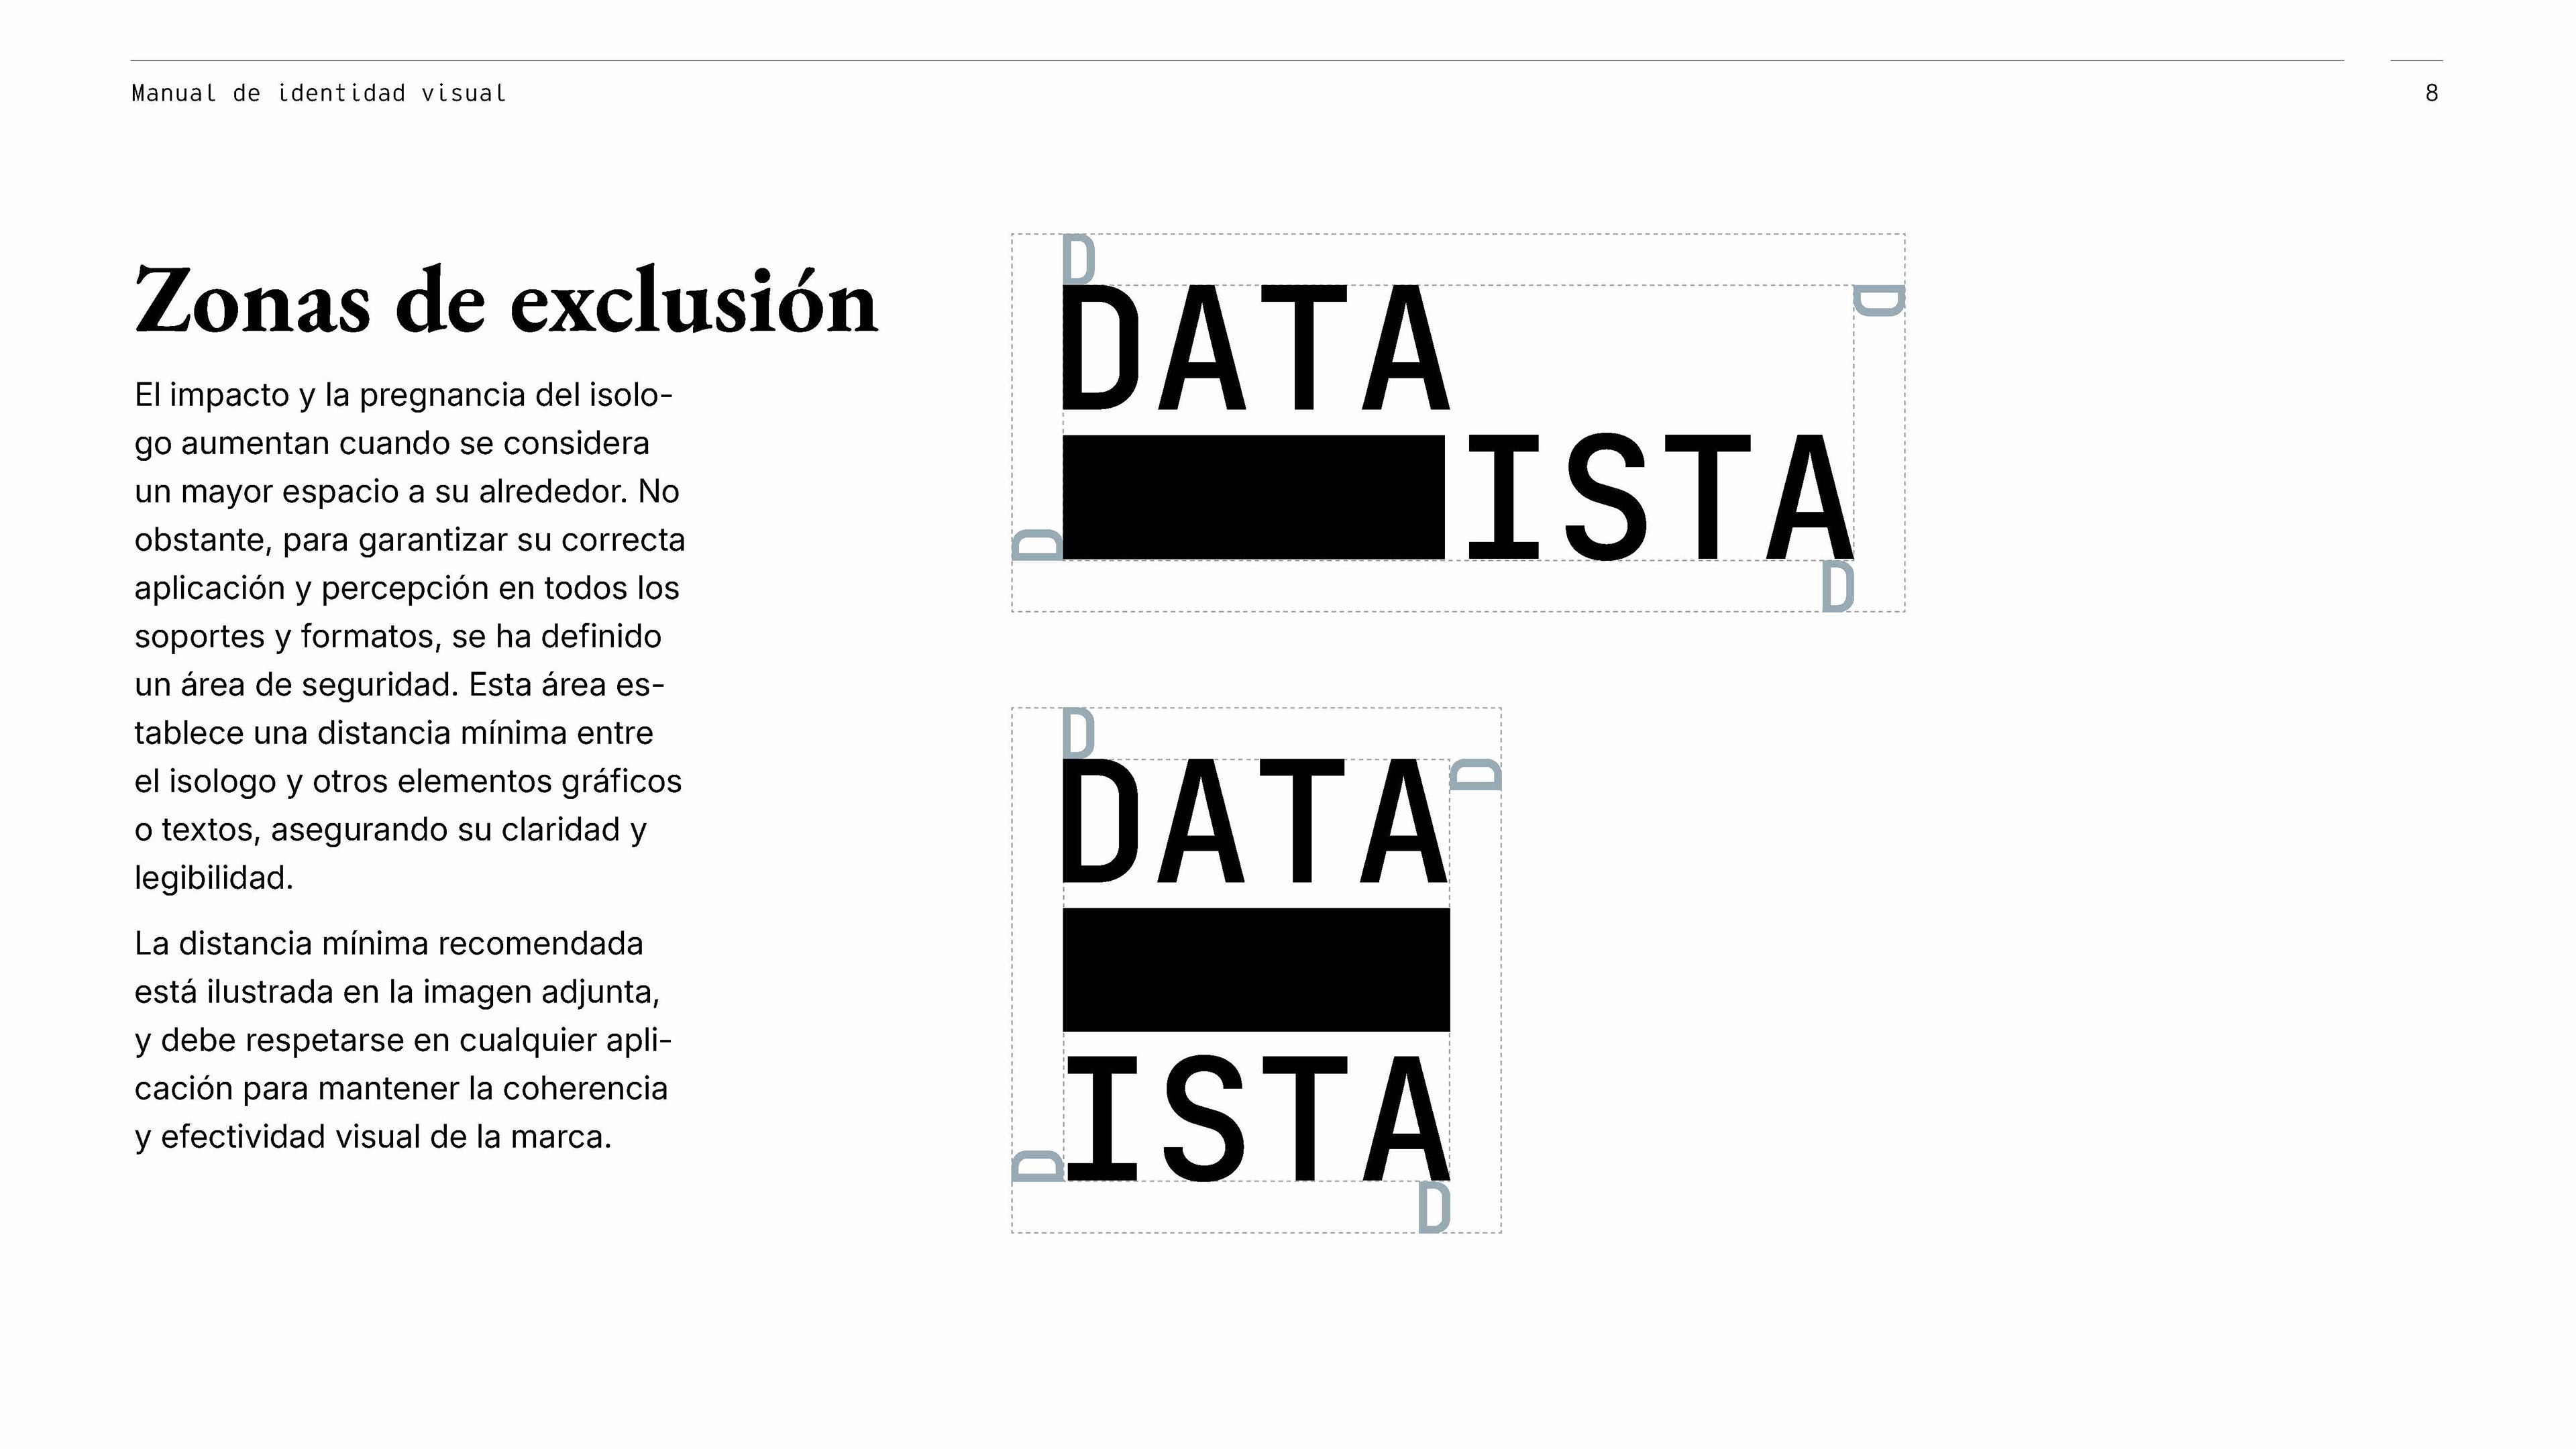
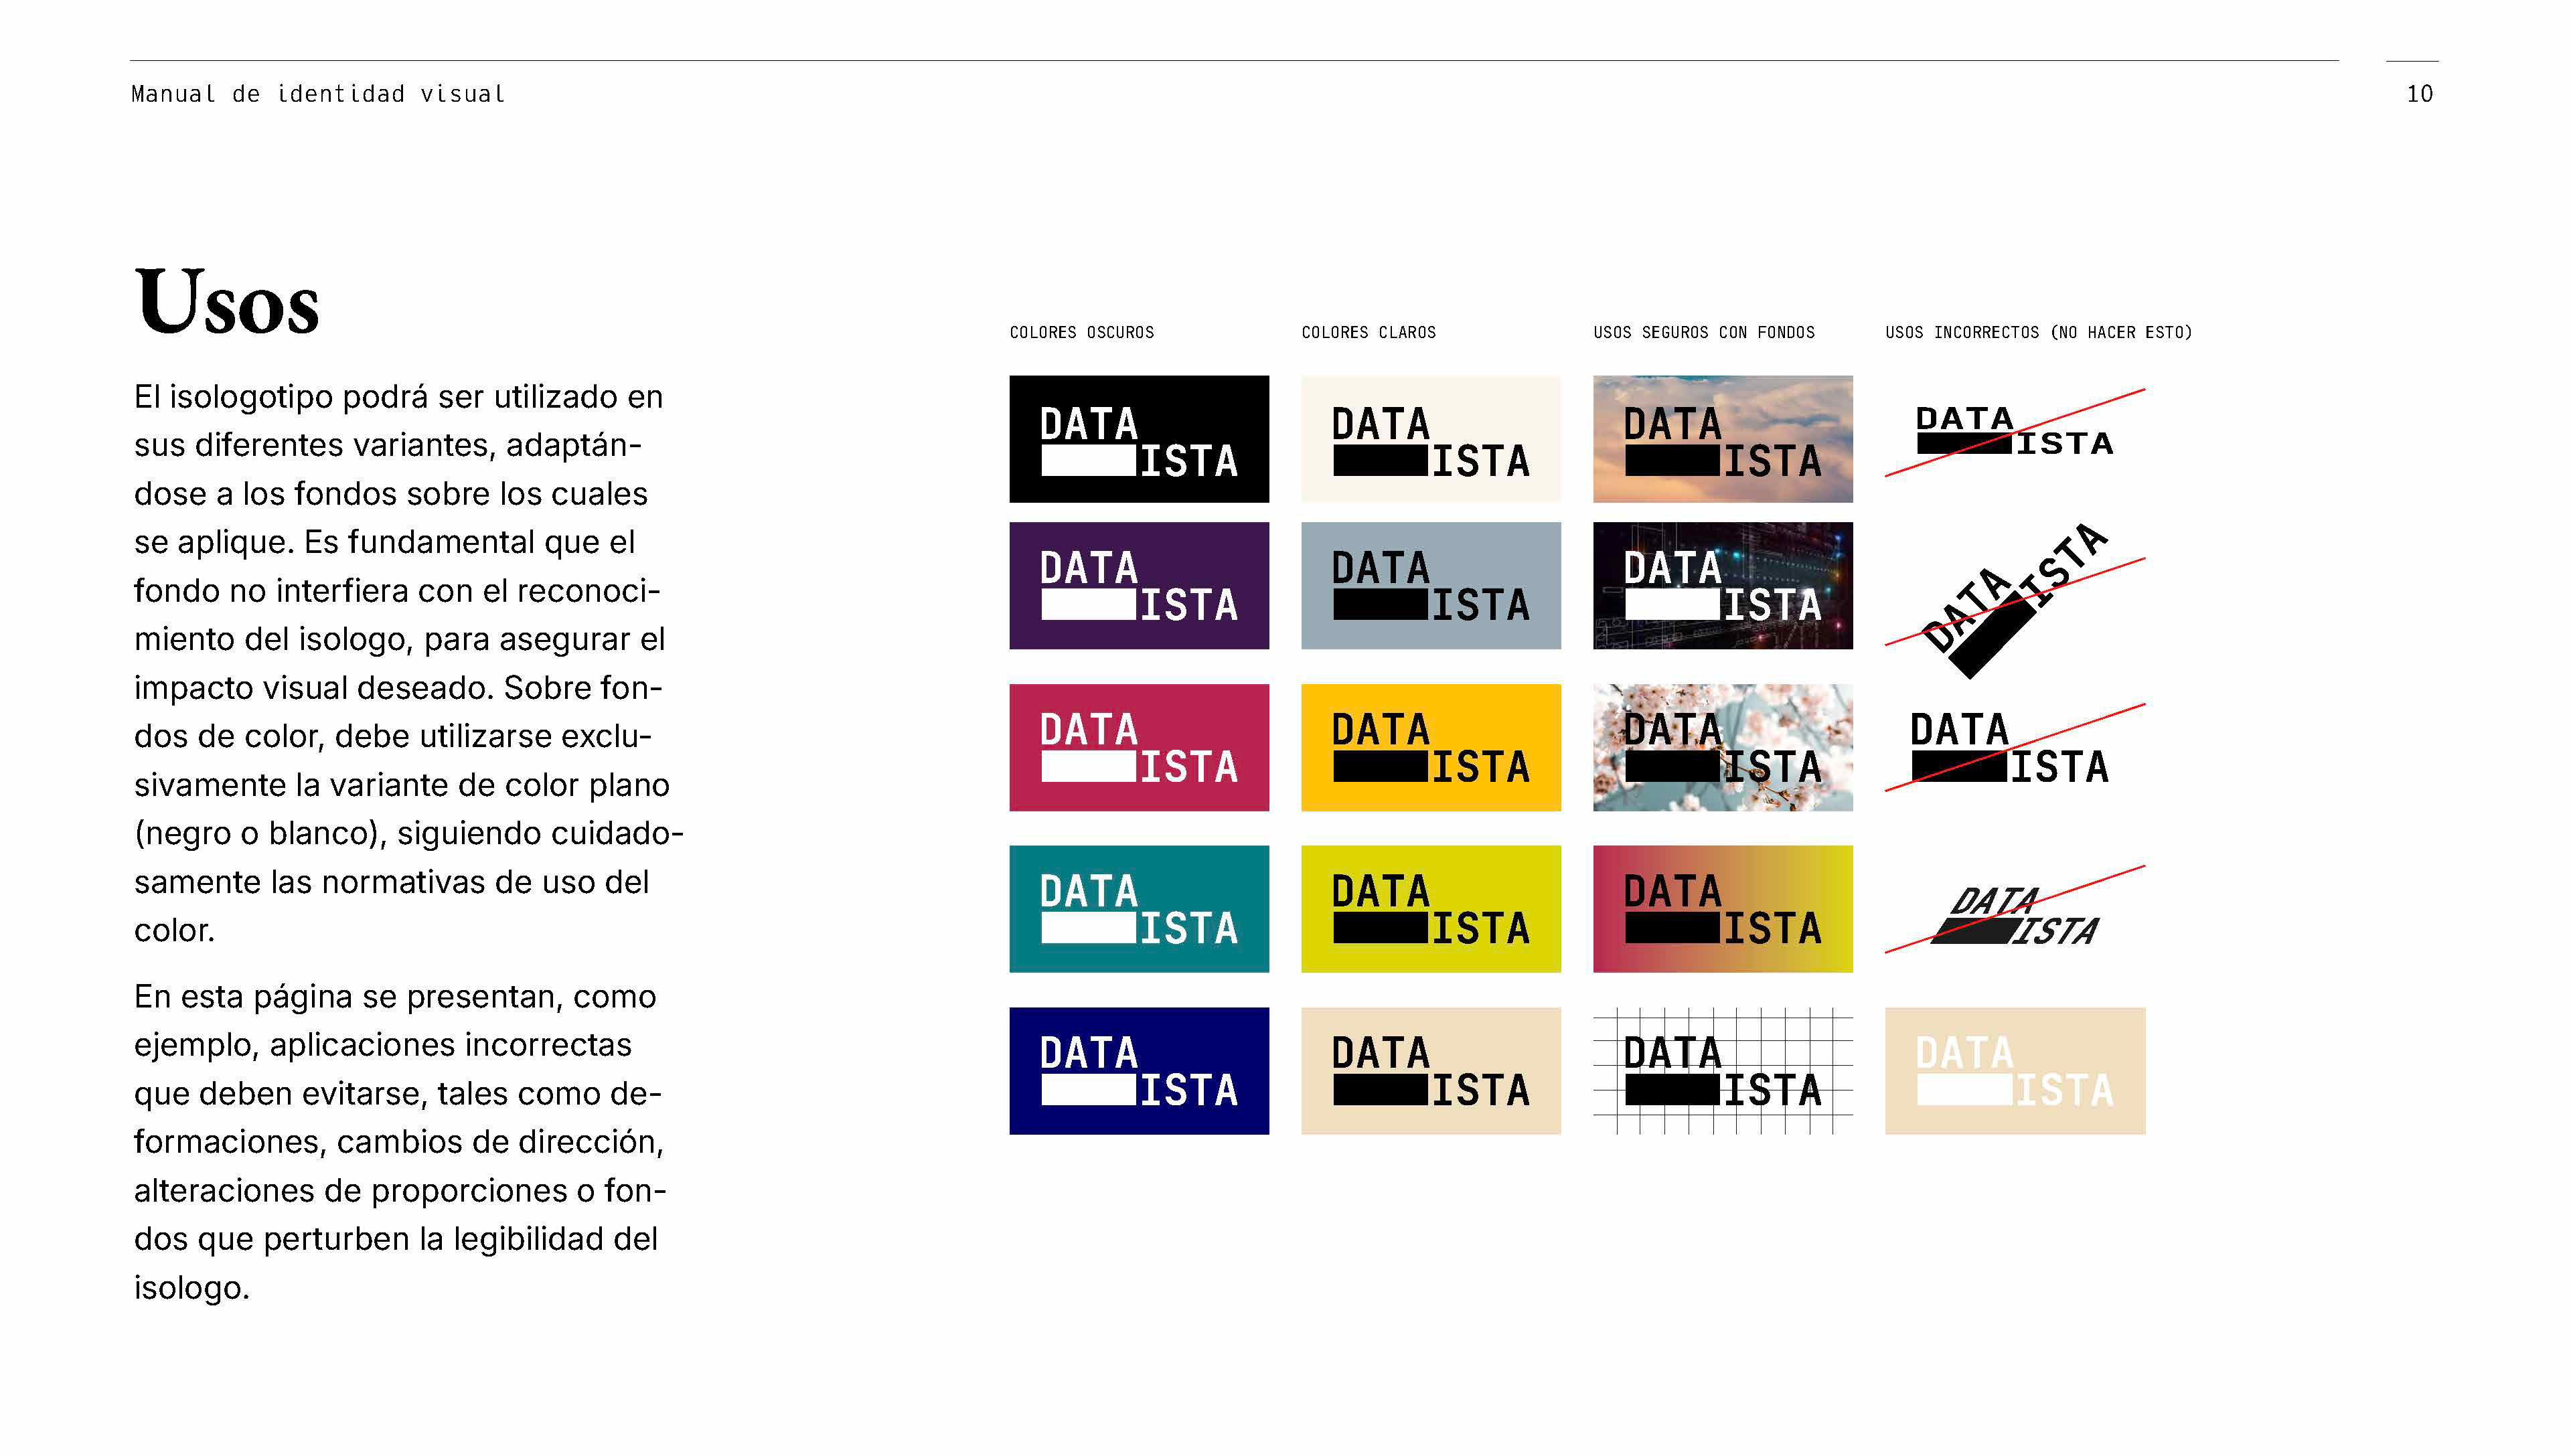
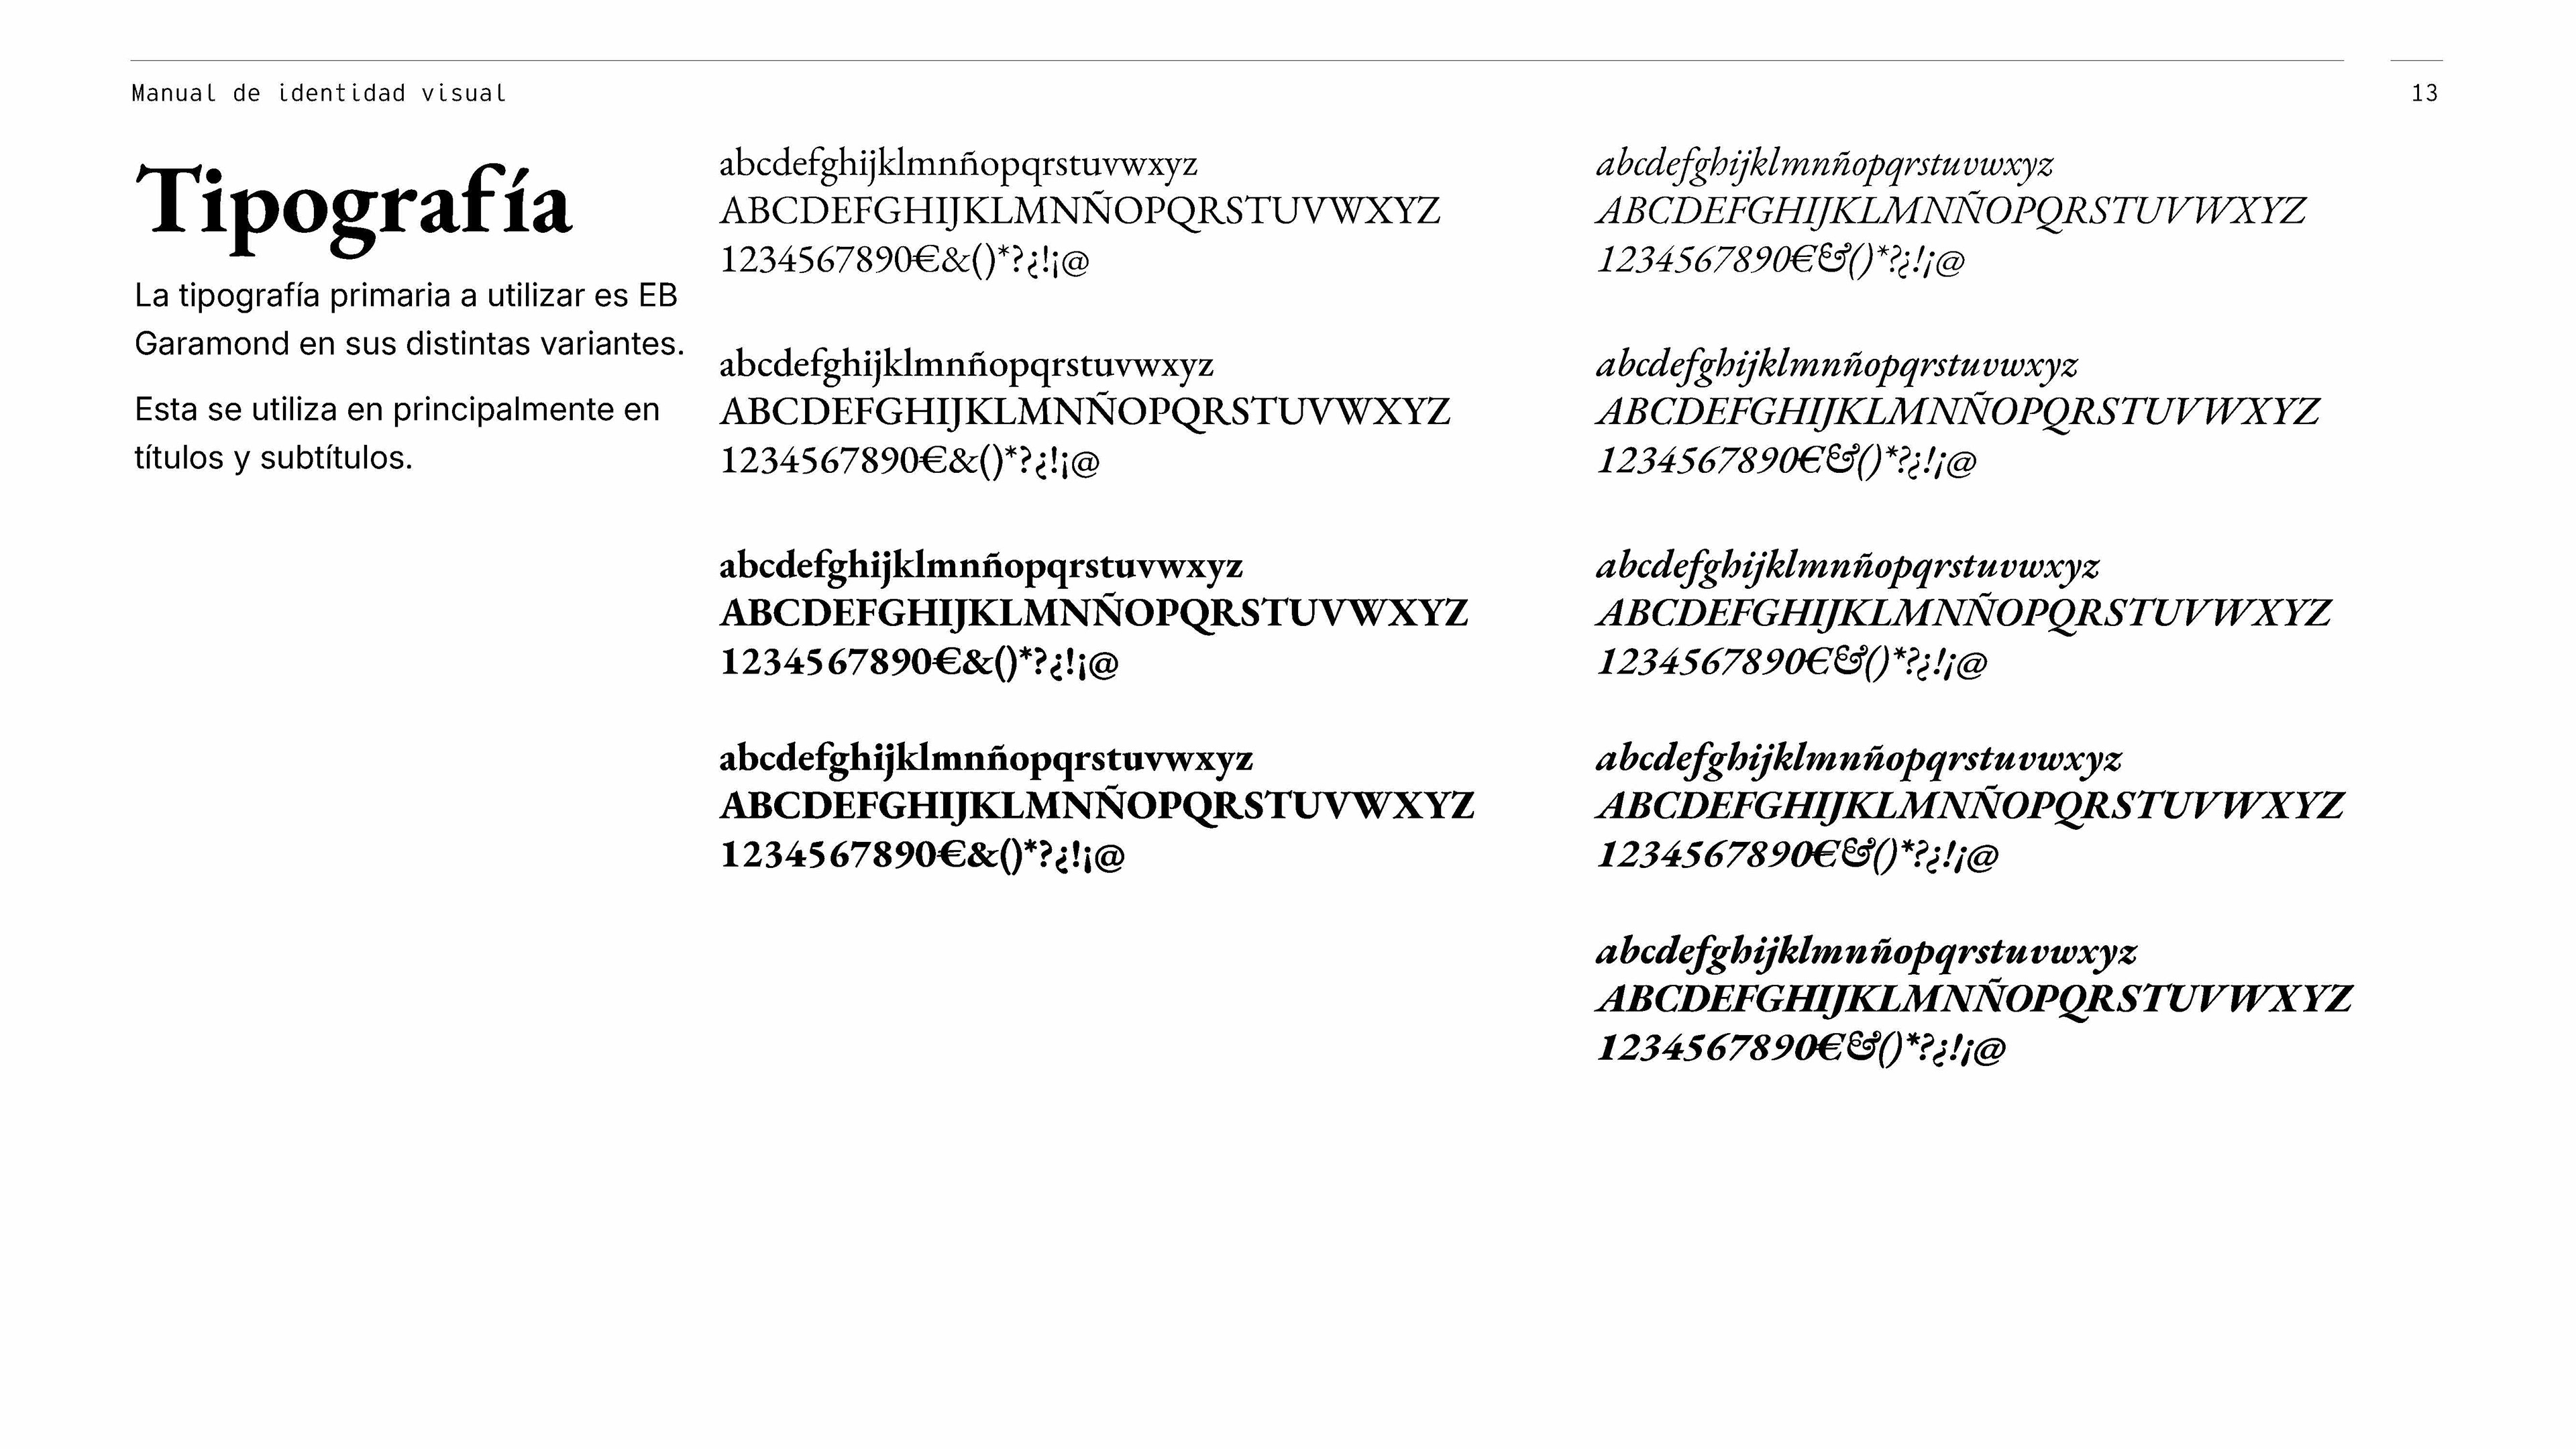
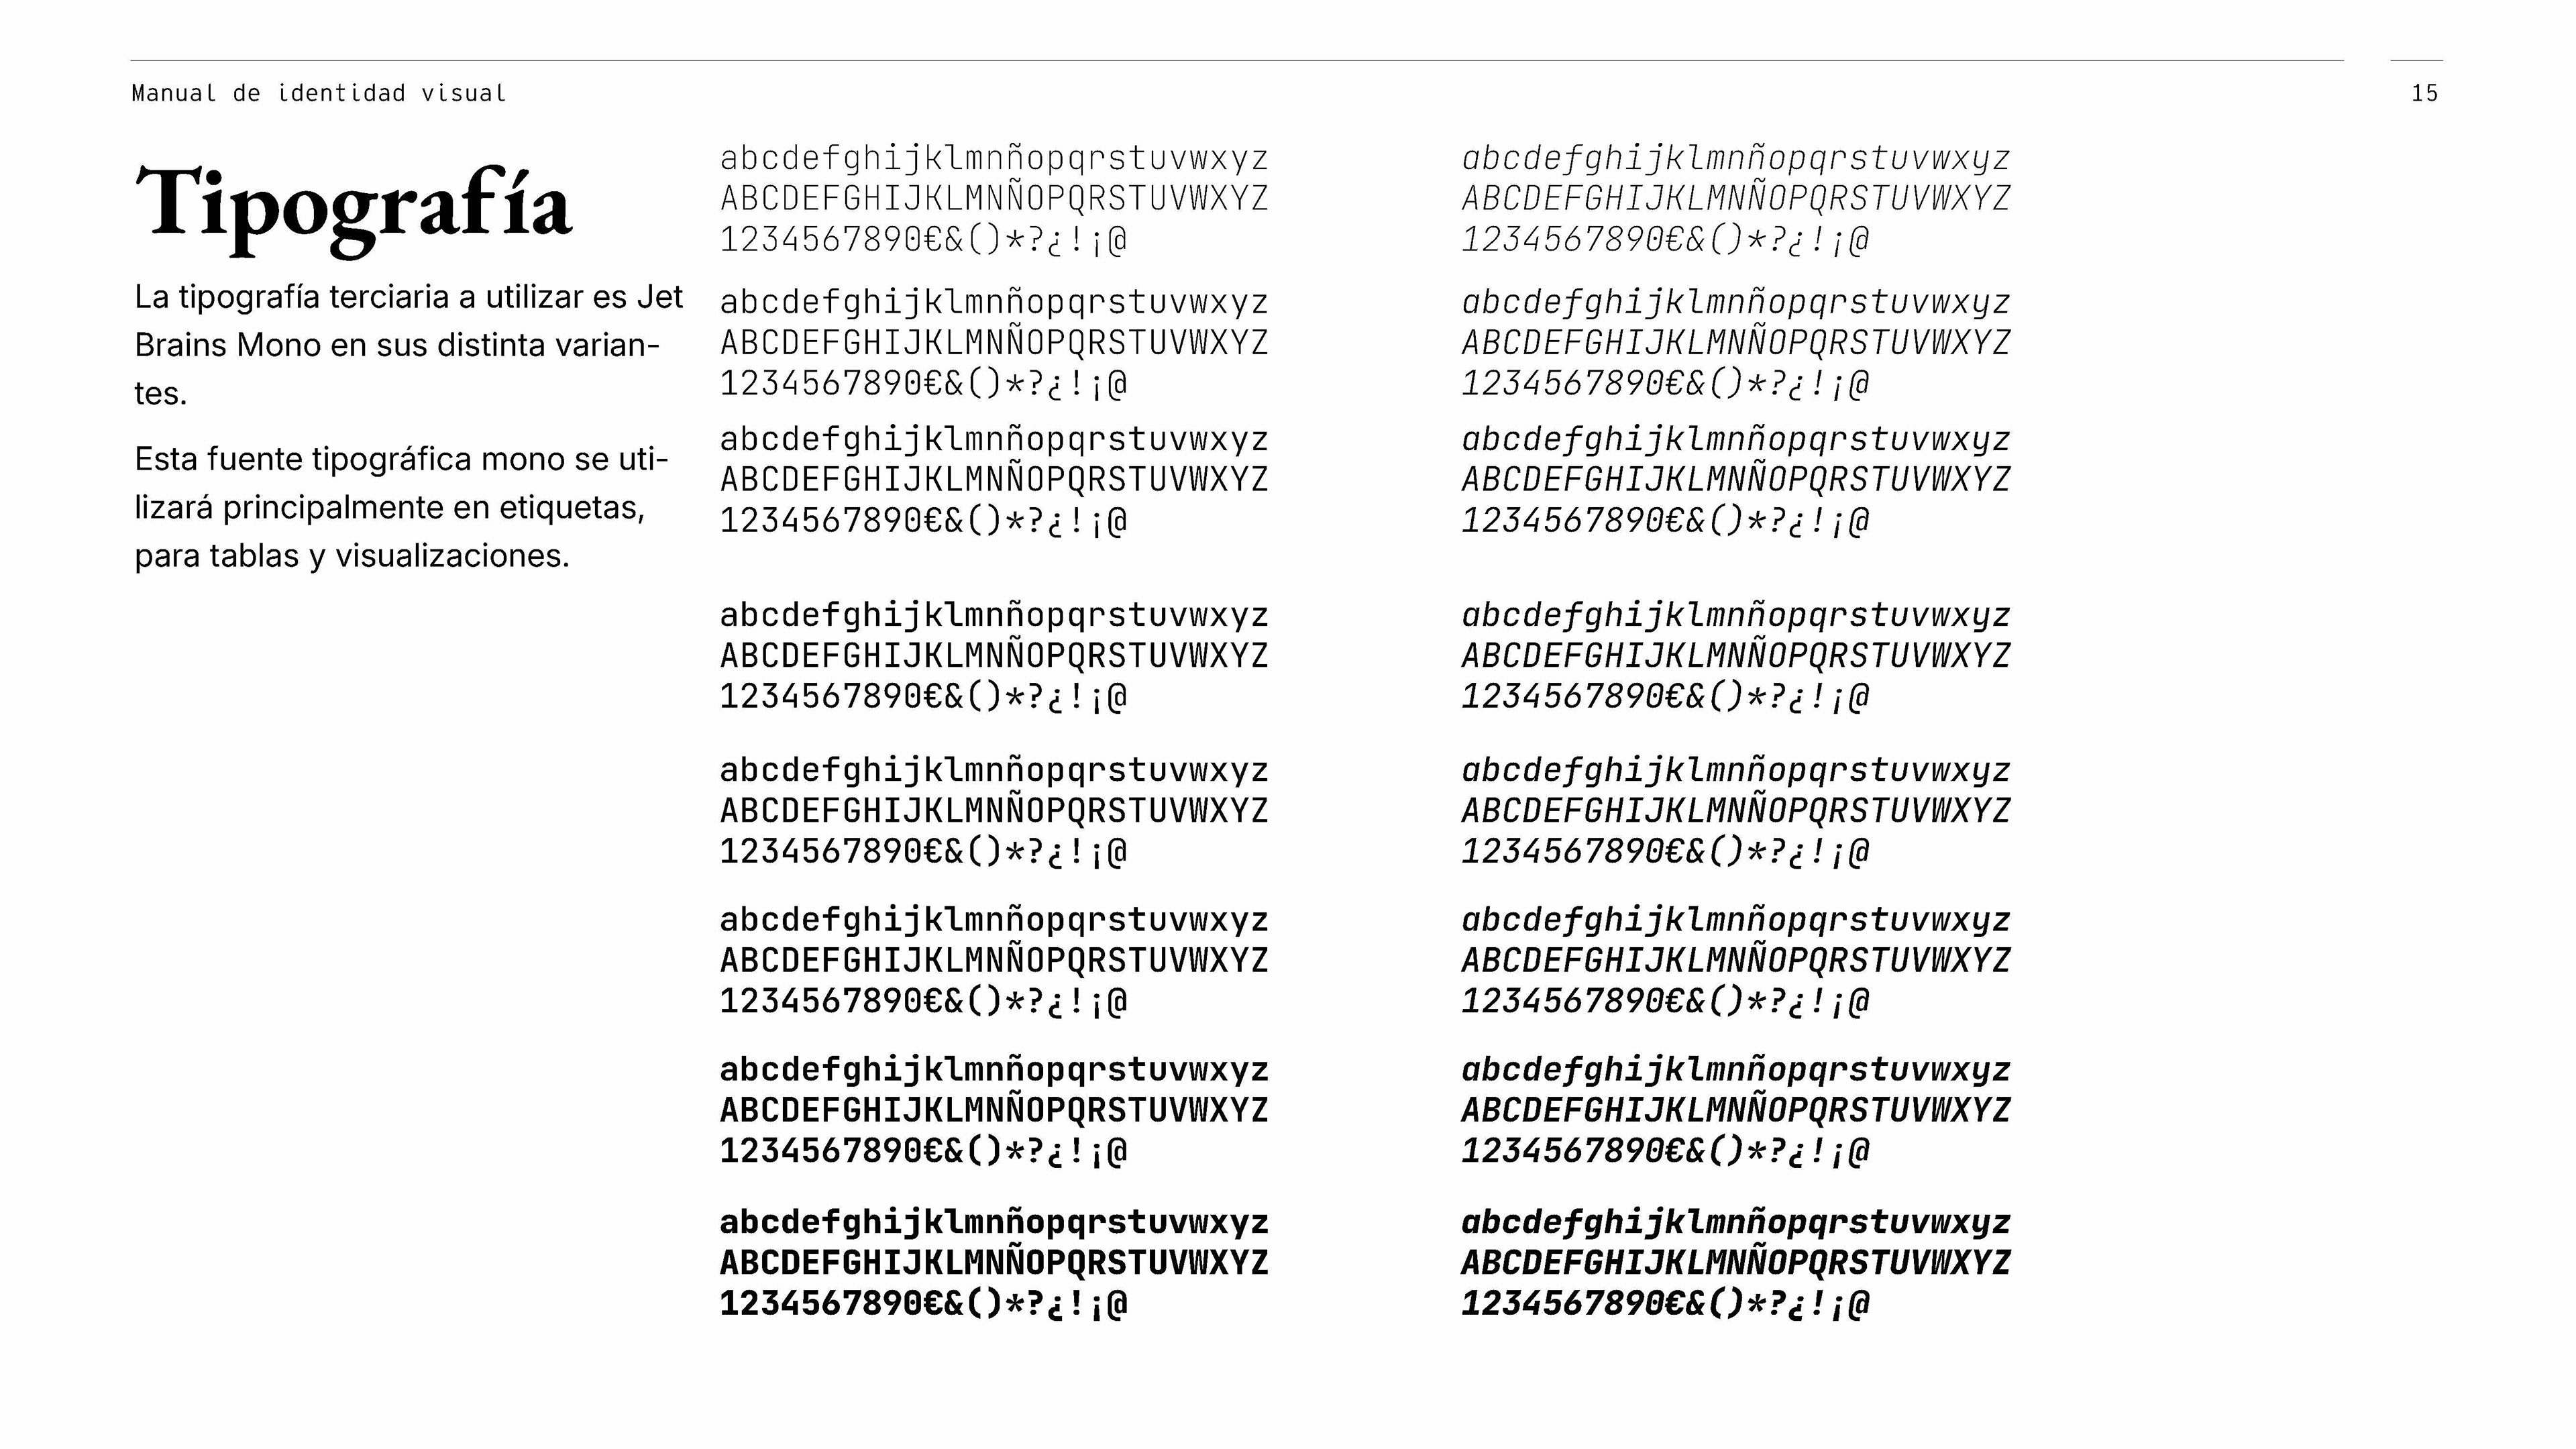
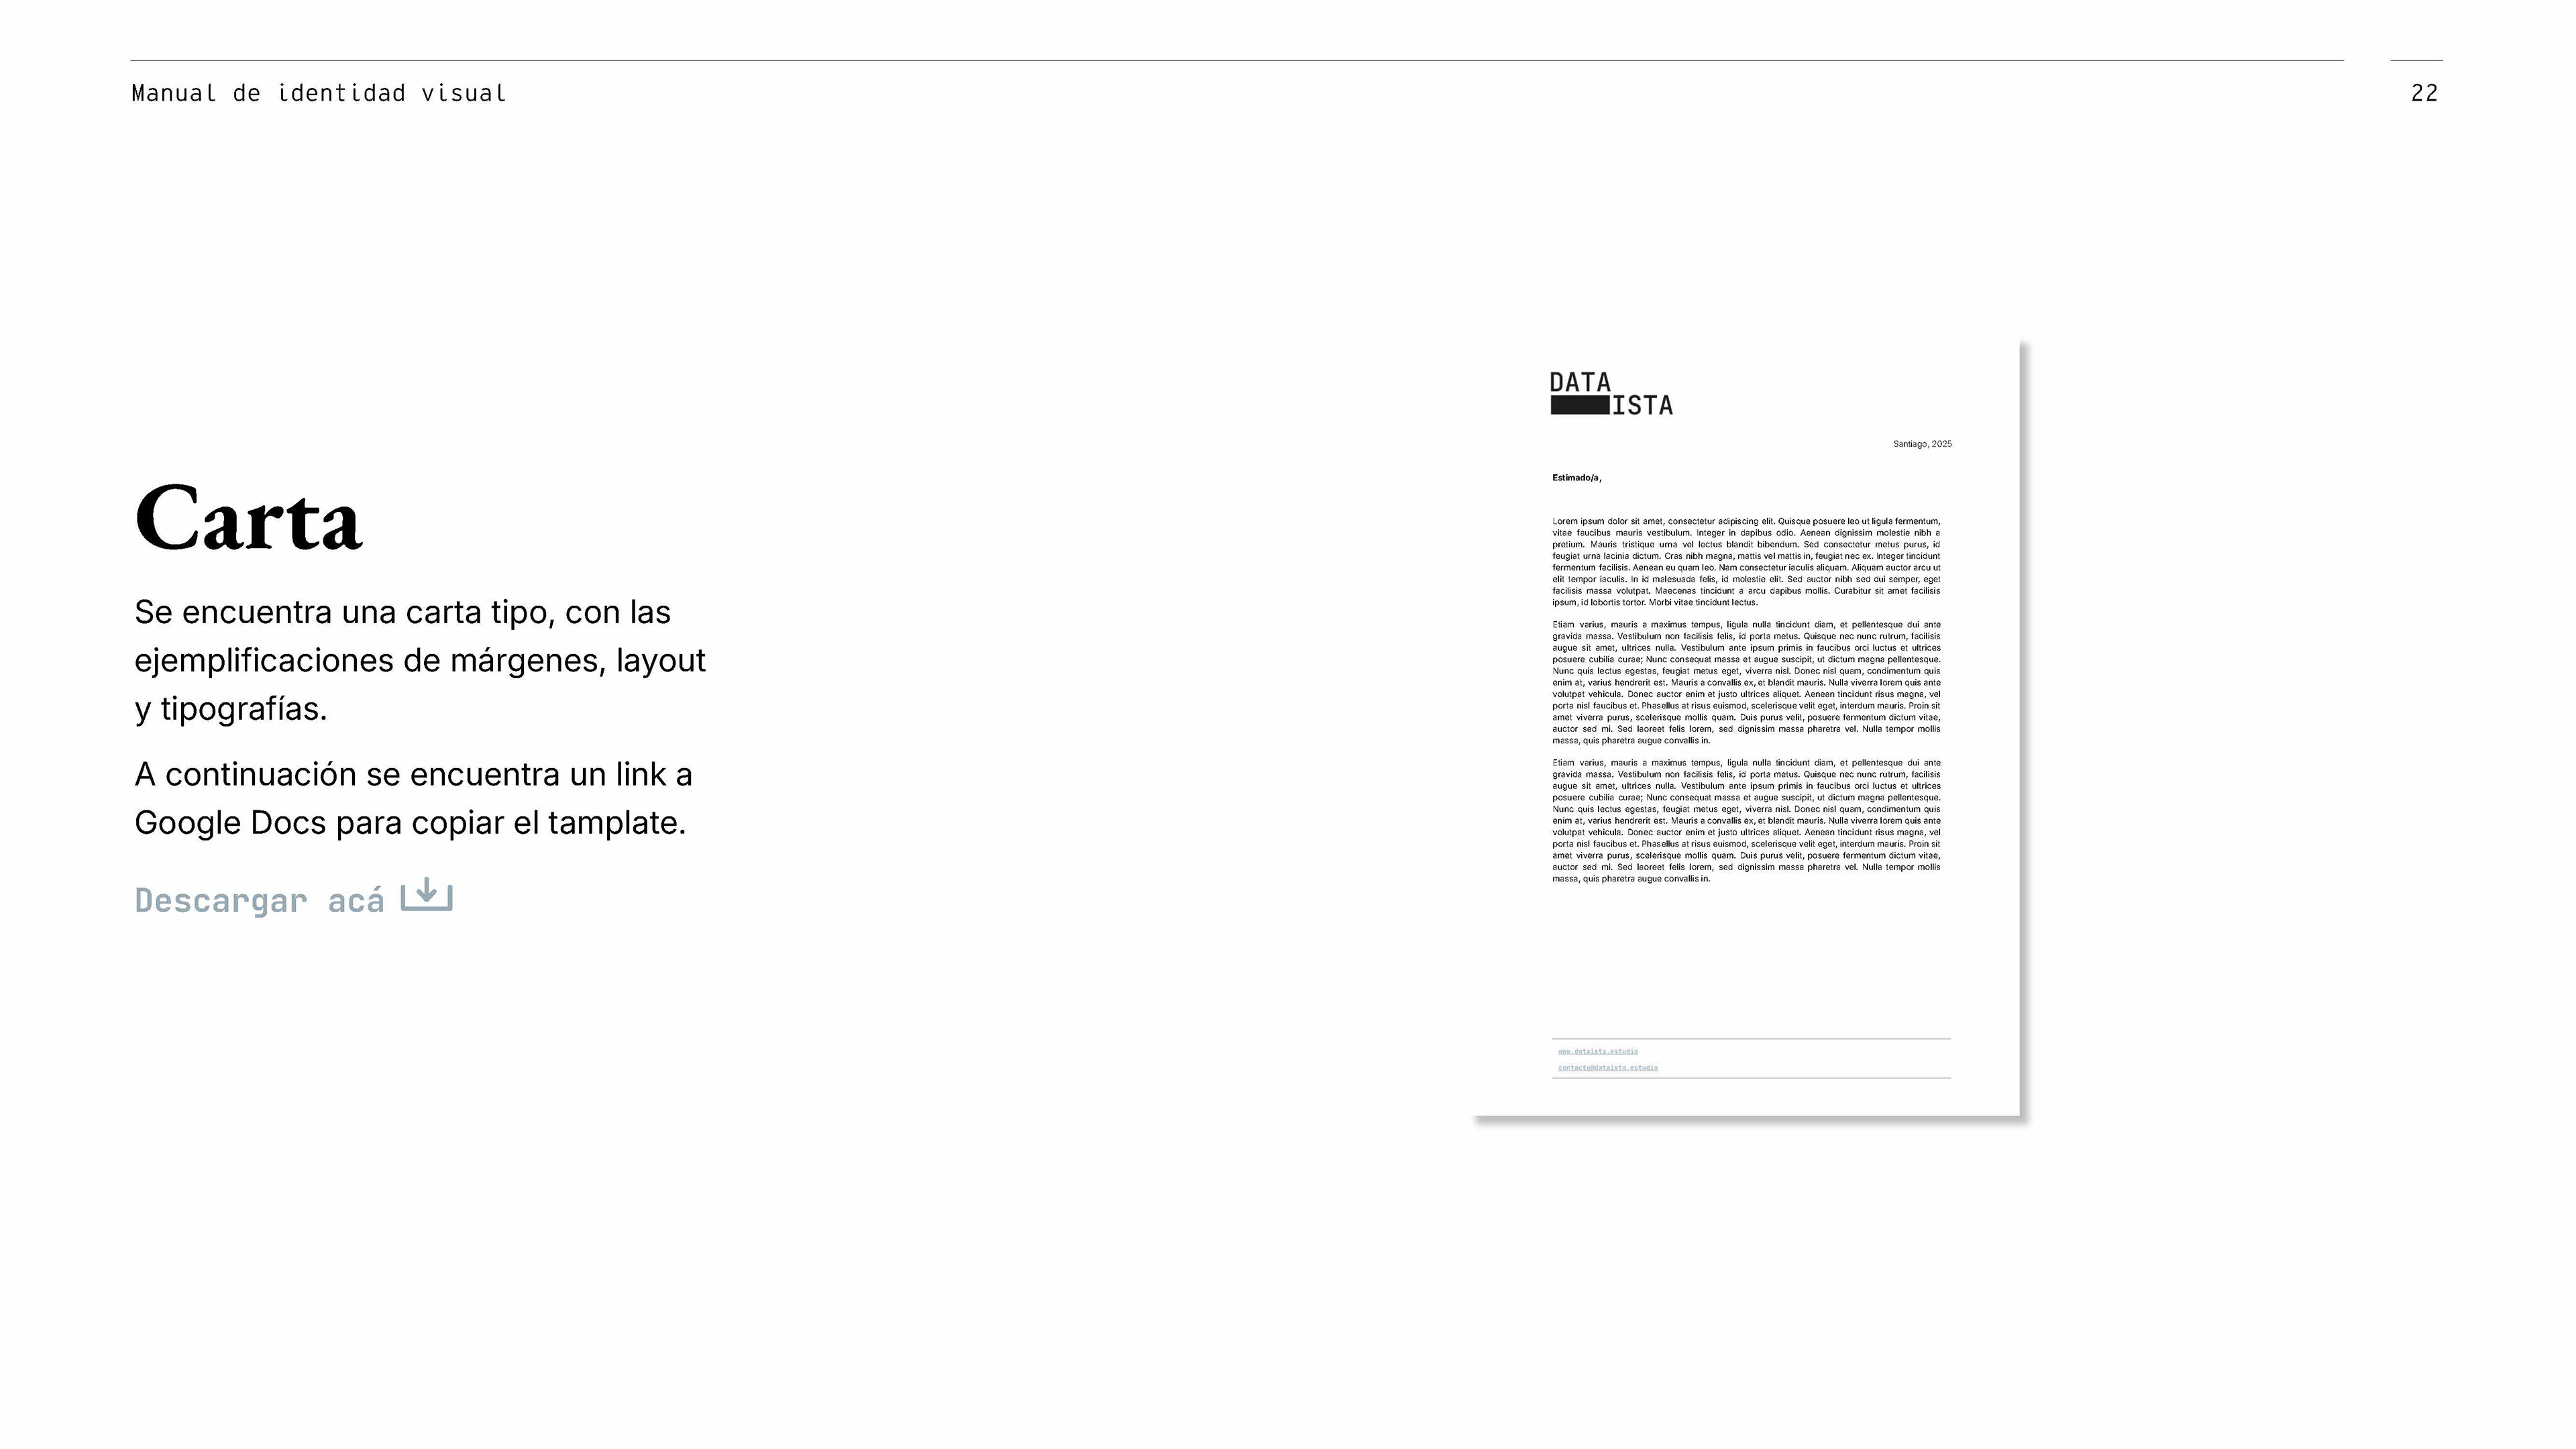
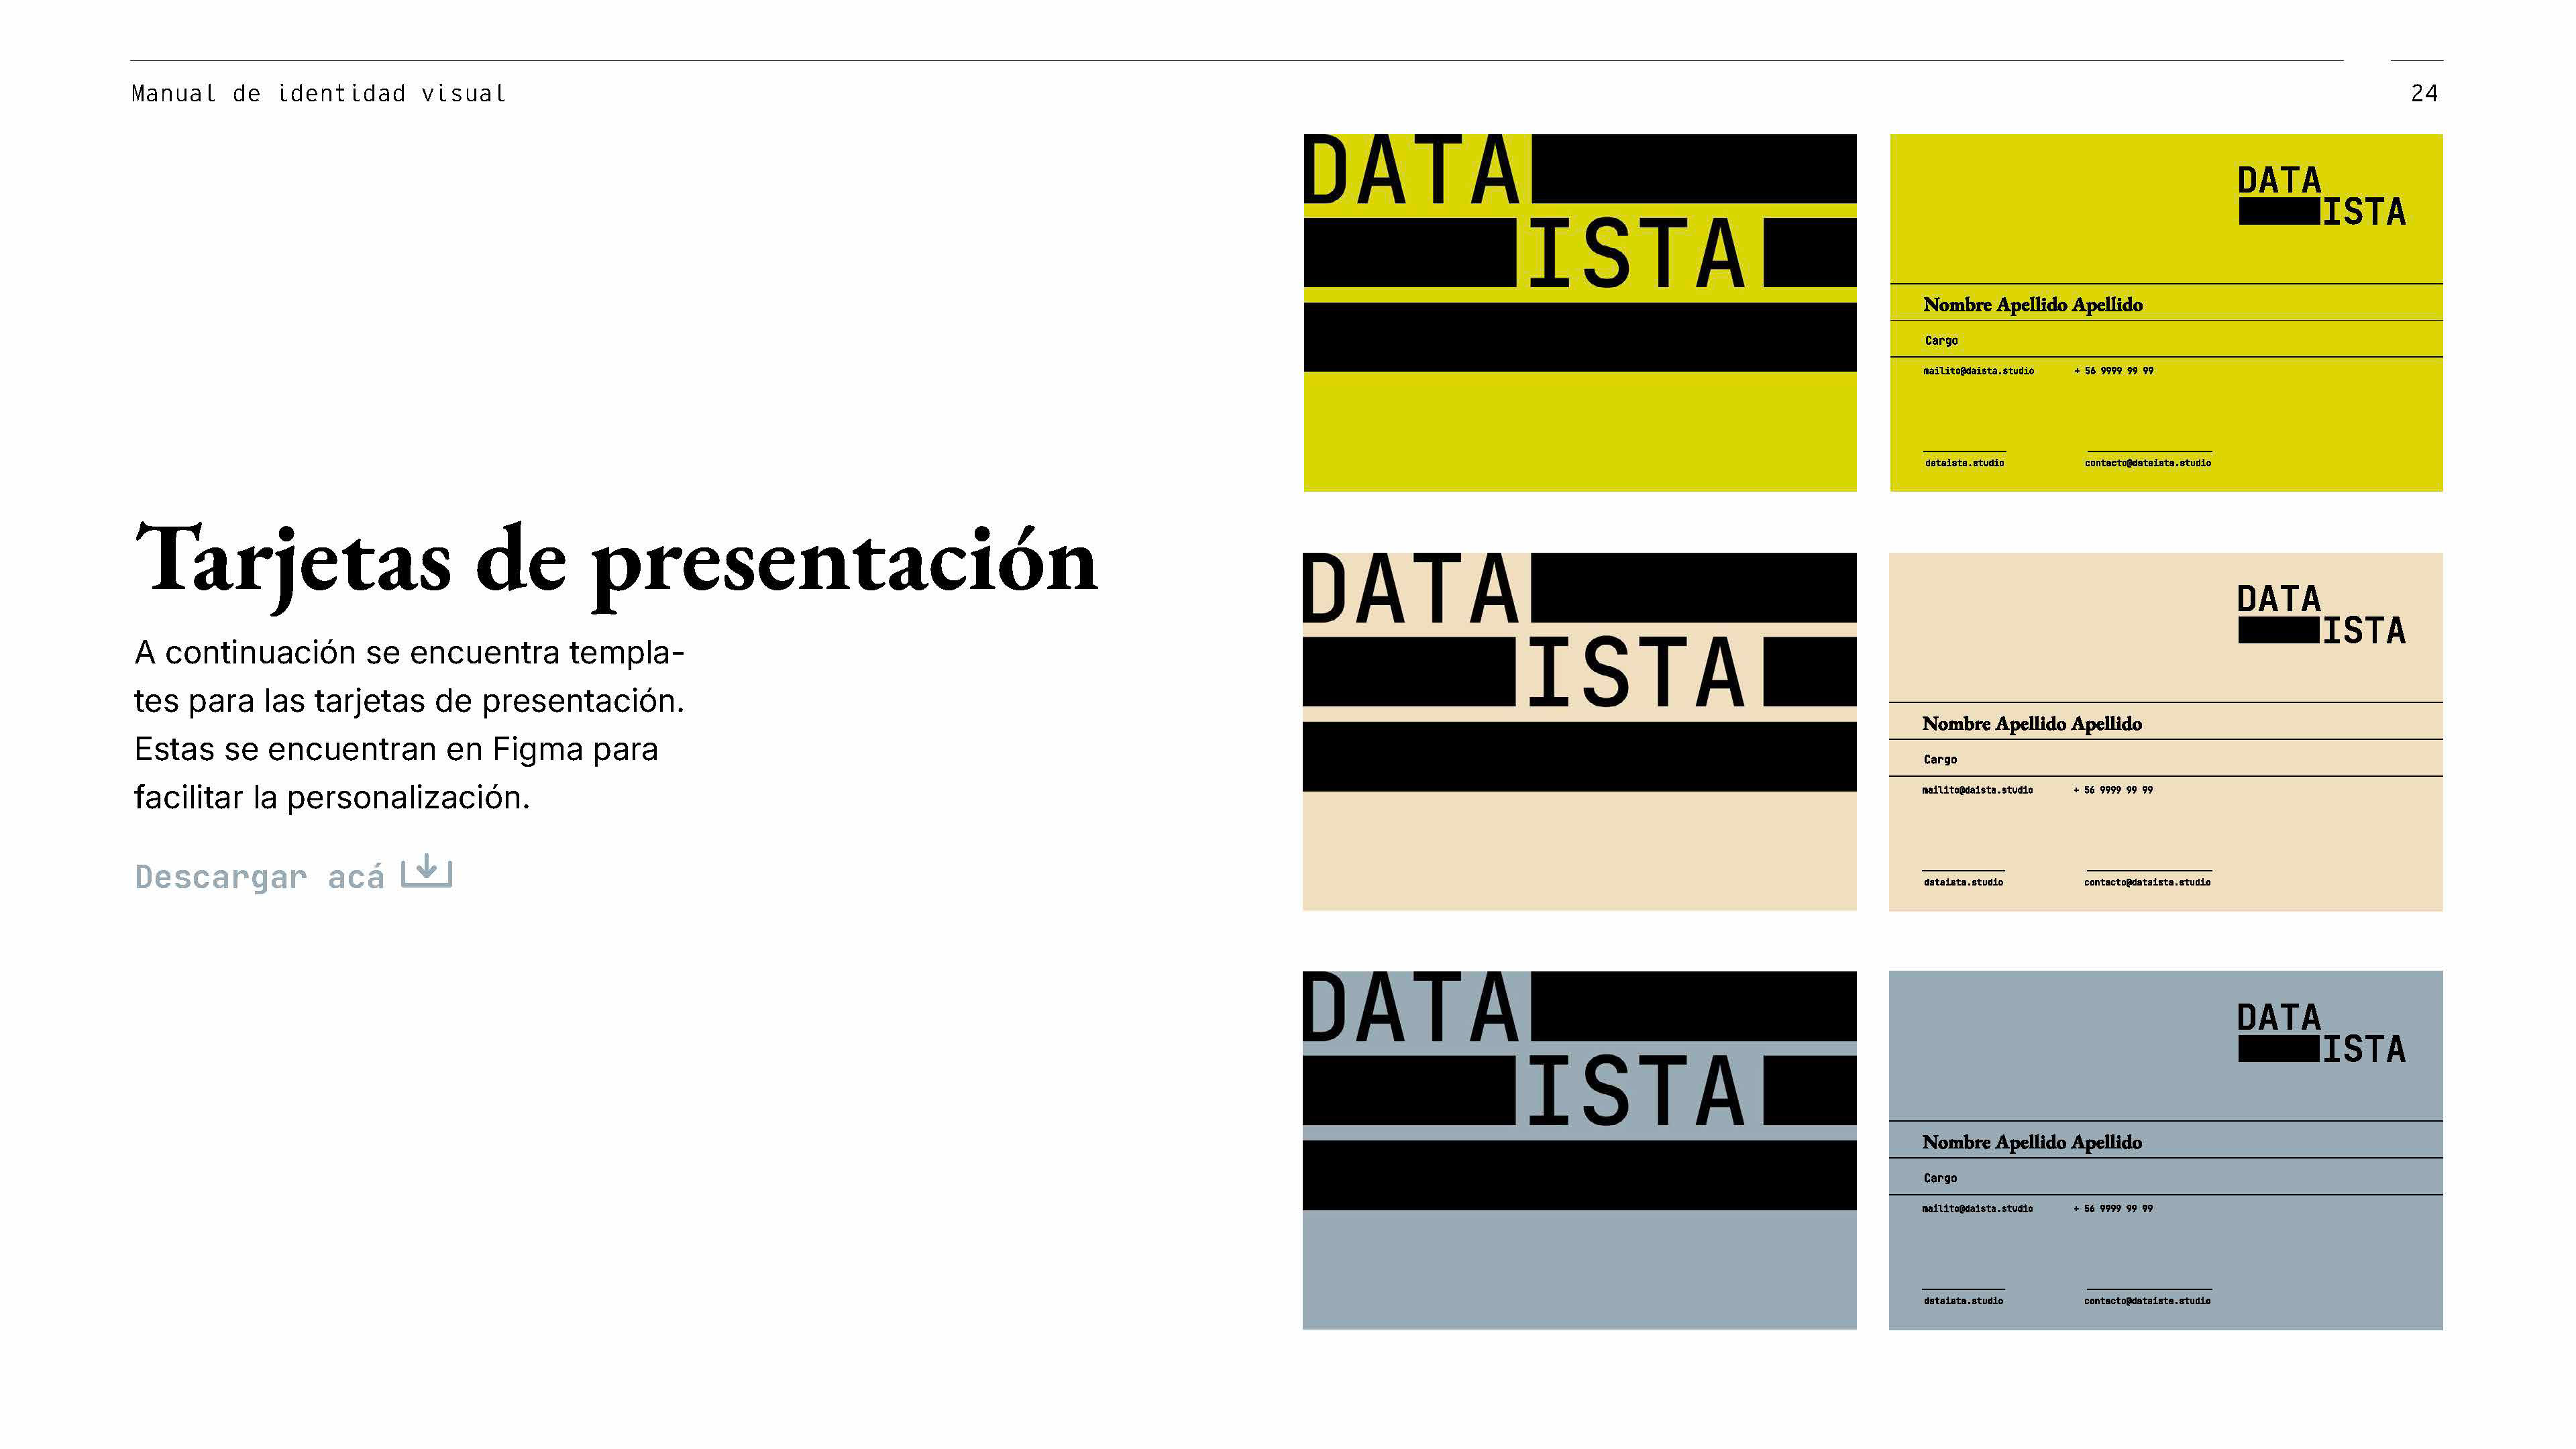
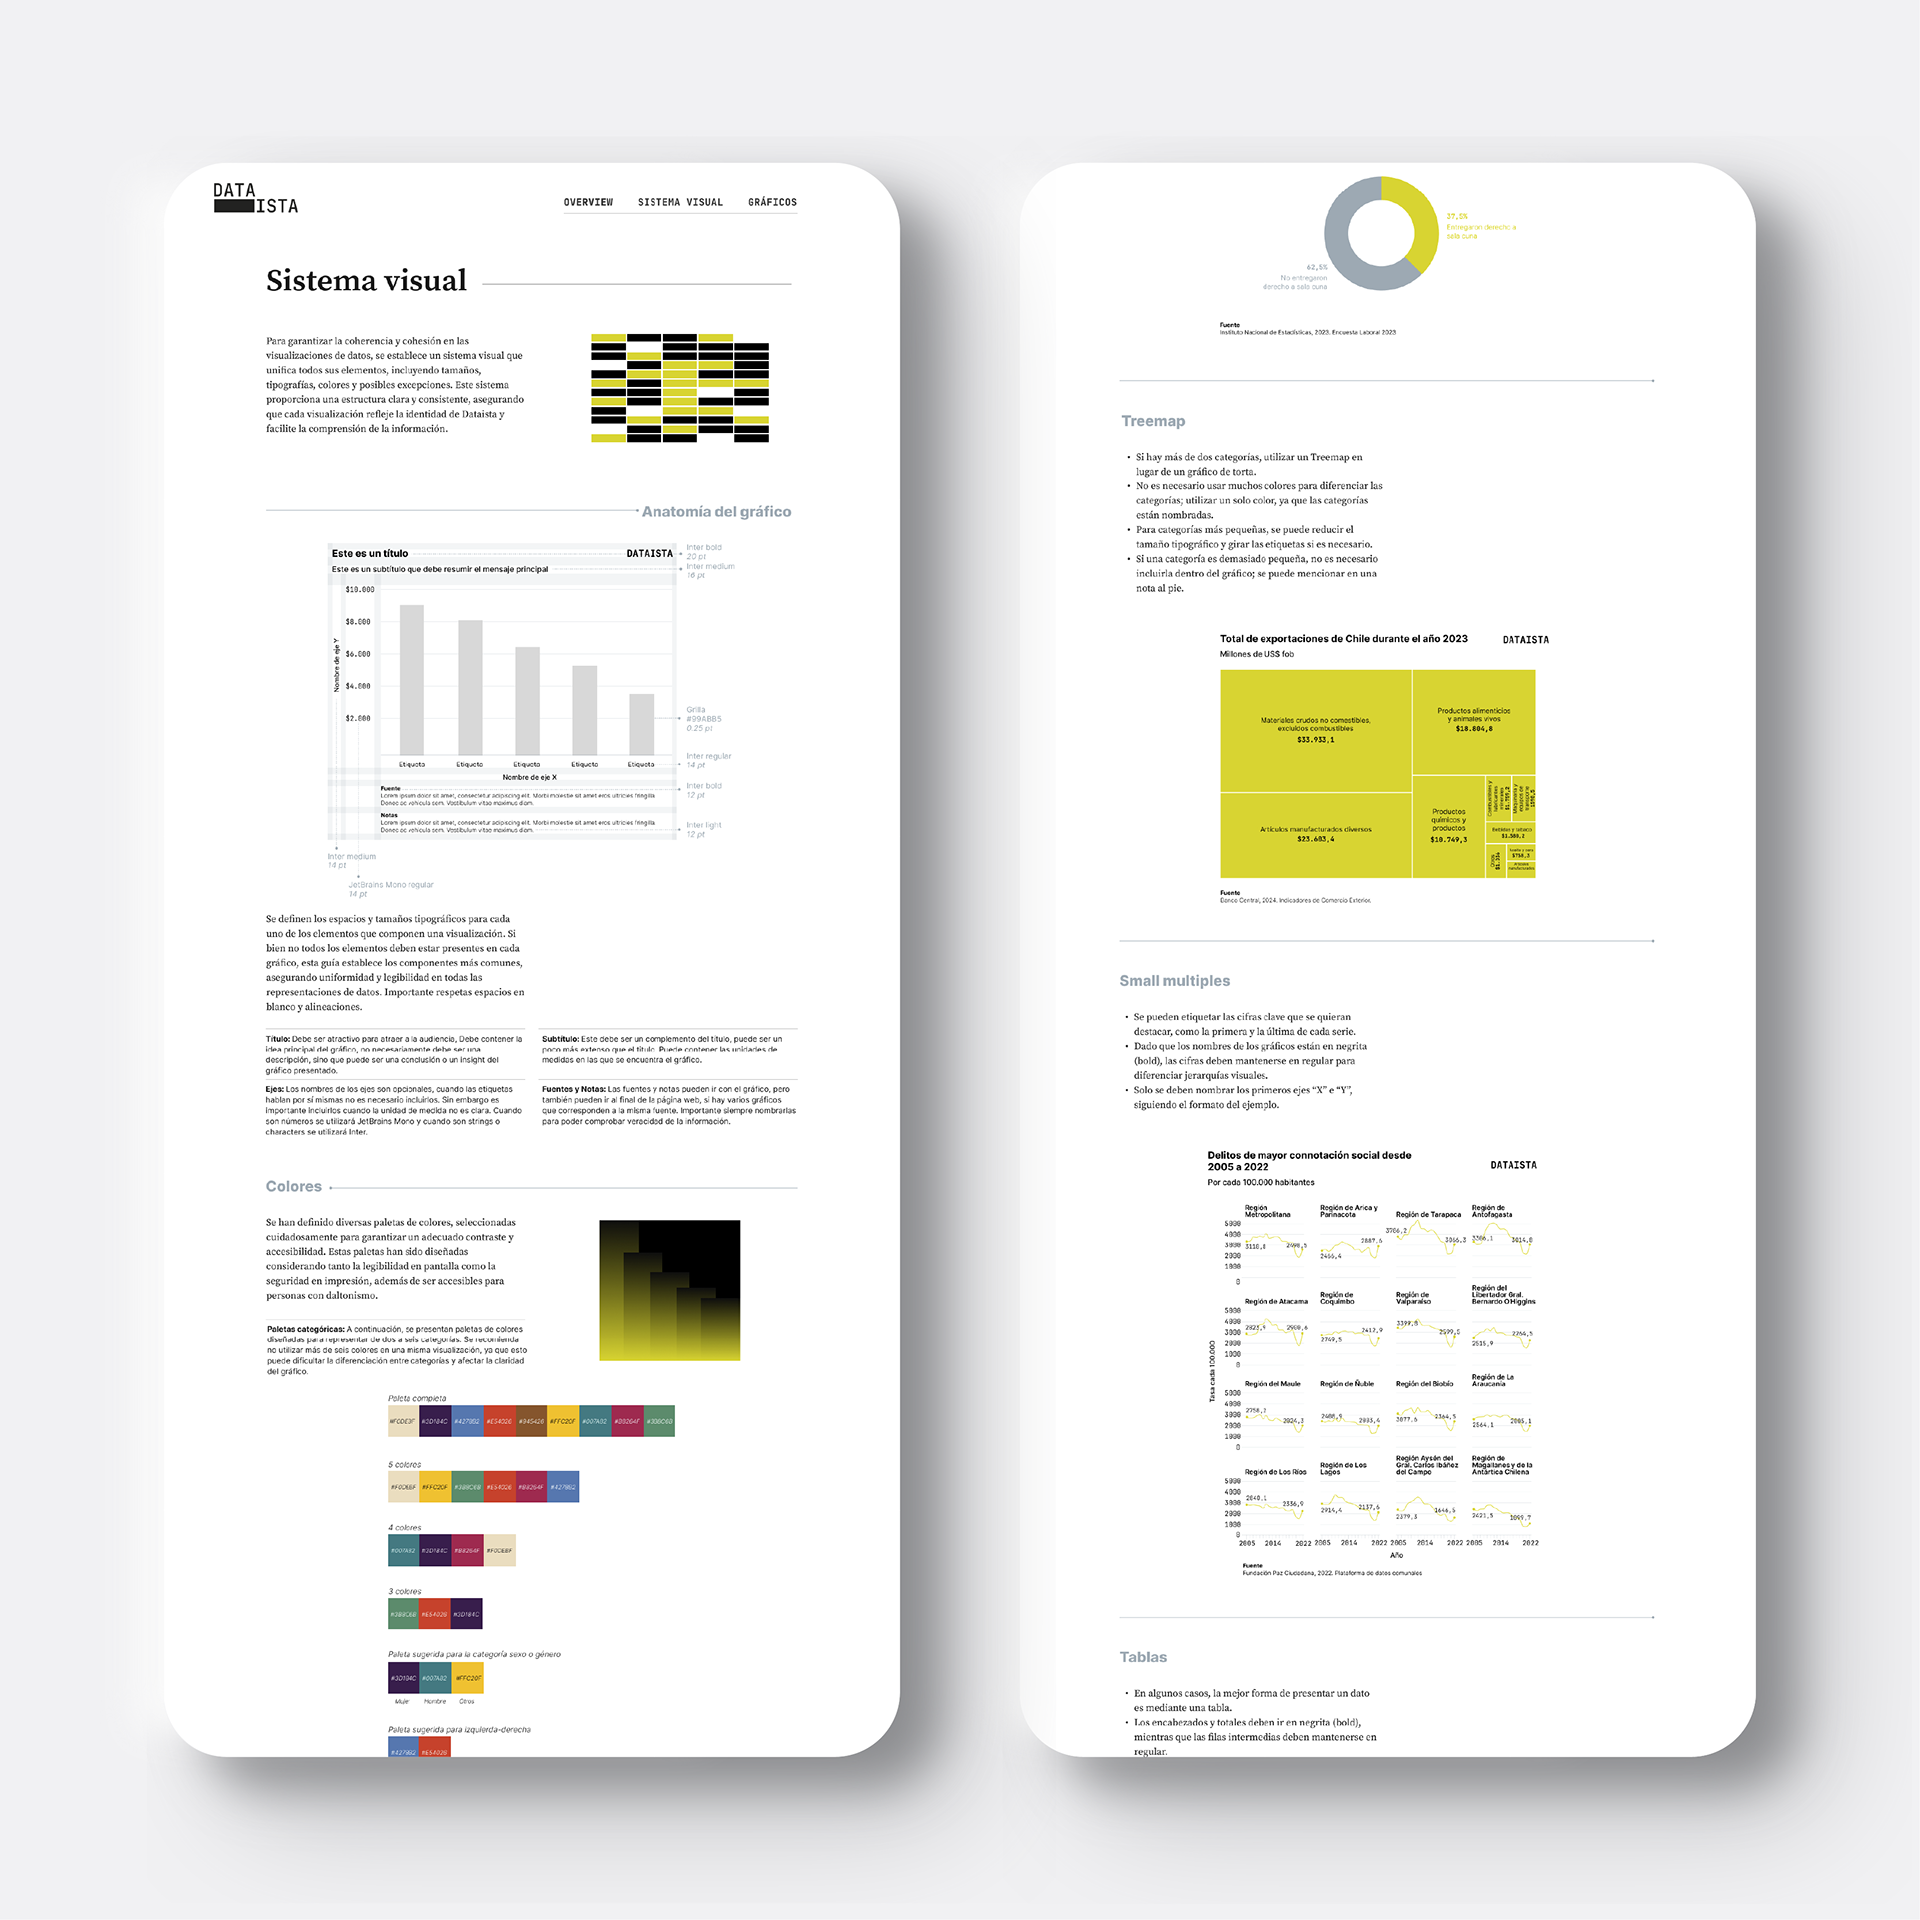
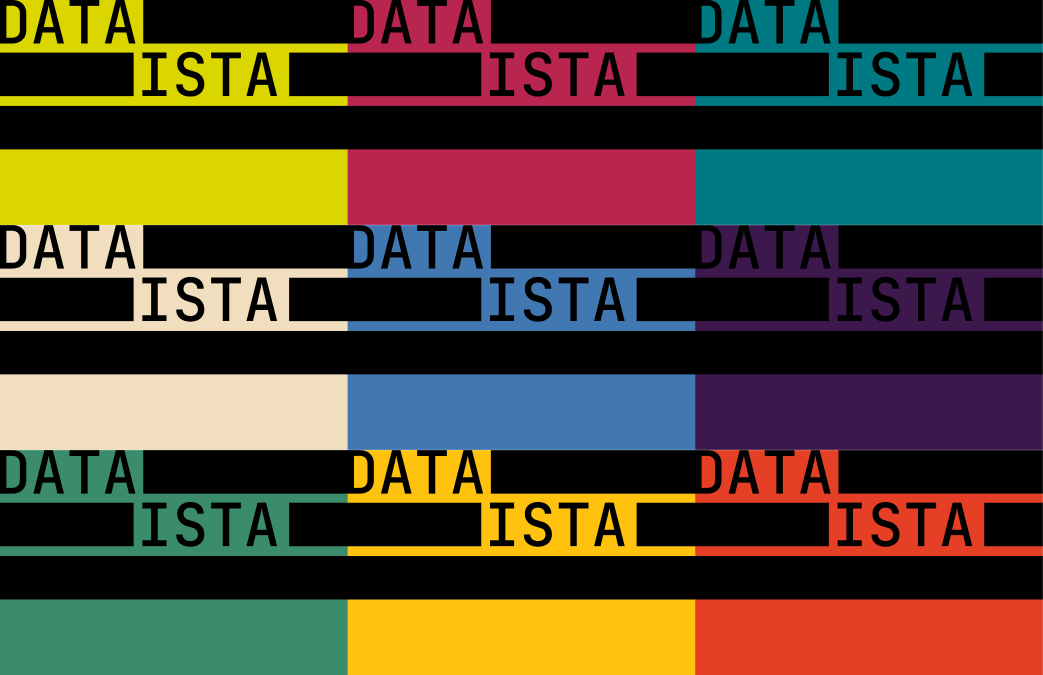
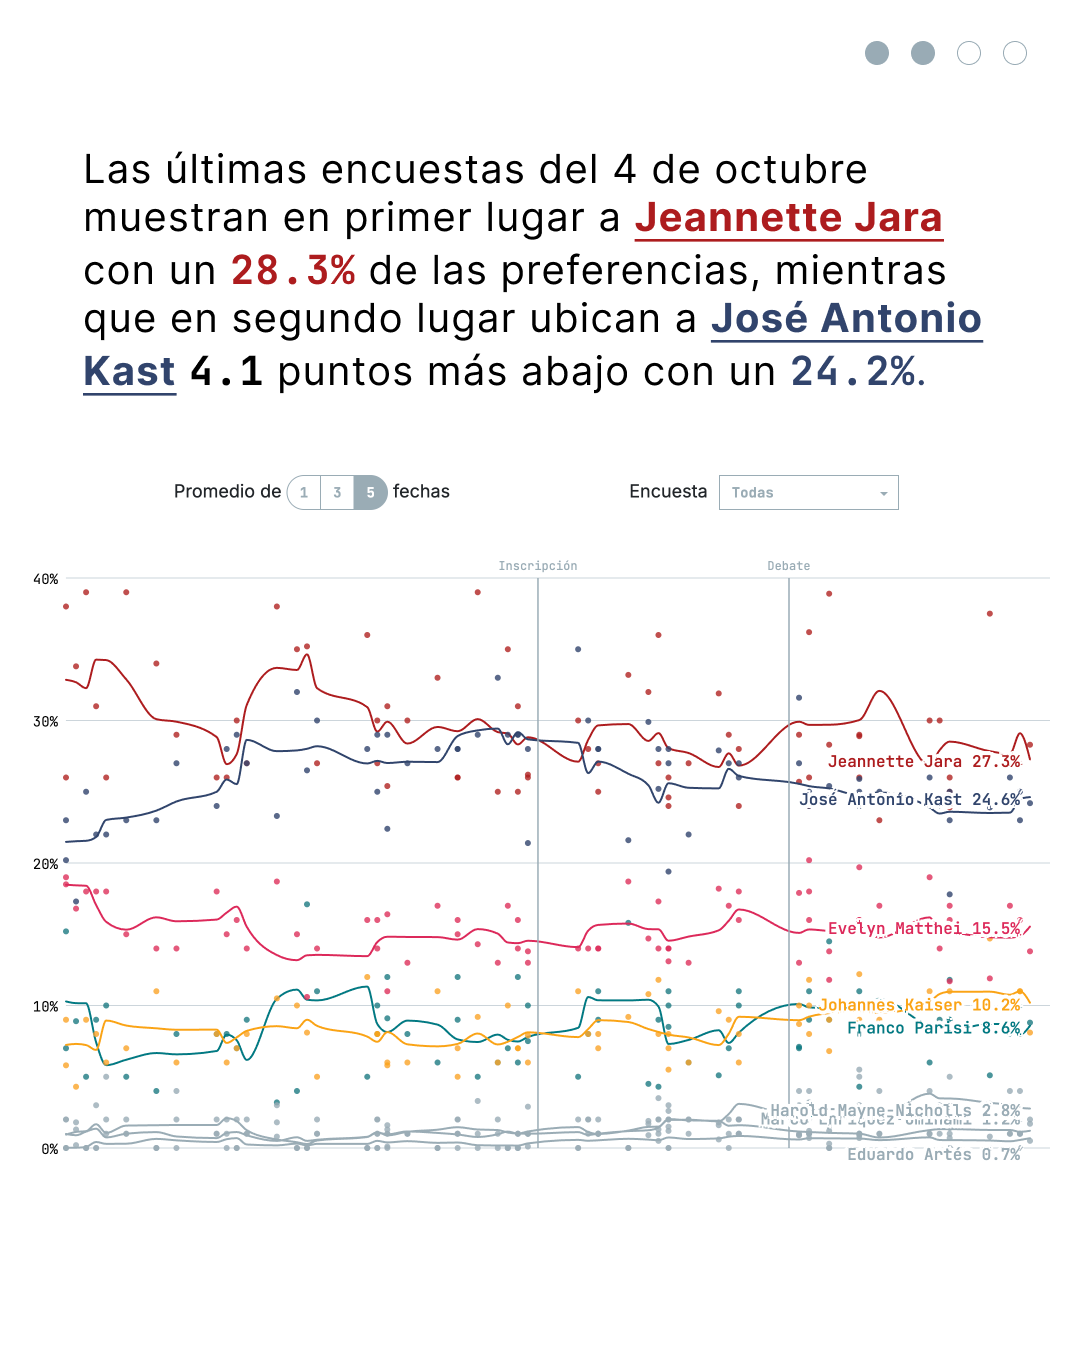
From the start, the identity was conceived as inseparable from data visualization. Its core element is a bar, the most basic unit of a chart, which works as a flexible device that can hold photographs, colors, and other content. The identity system includes logos, color palettes, and applications across contexts such as documents, budgets, and the website. The visualization guidelines extend that language into the charts themselves, defining colors, typography, chart types, tables, and elements such as legends, titles, labels, and number formatting. Together they give Dataista a recognizable voice and a practical toolkit that makes producing new data stories faster and more consistent.
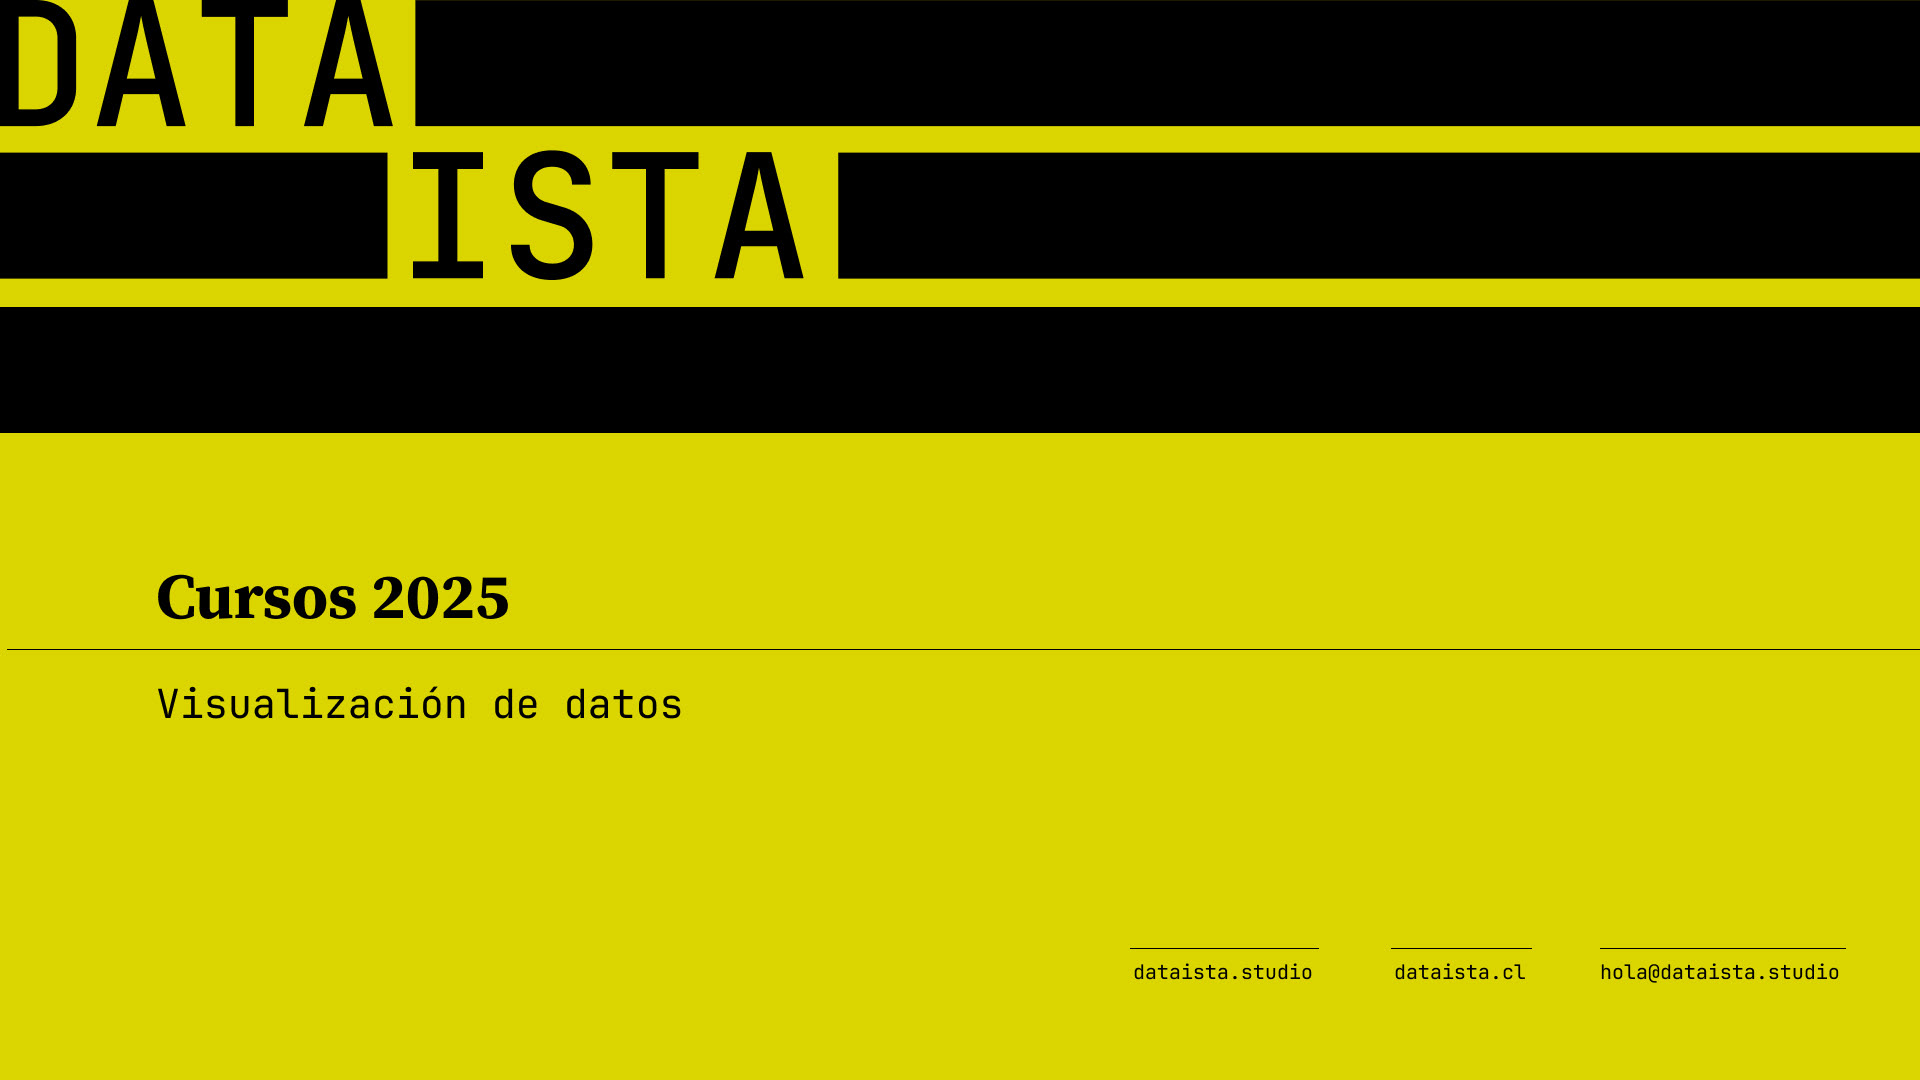
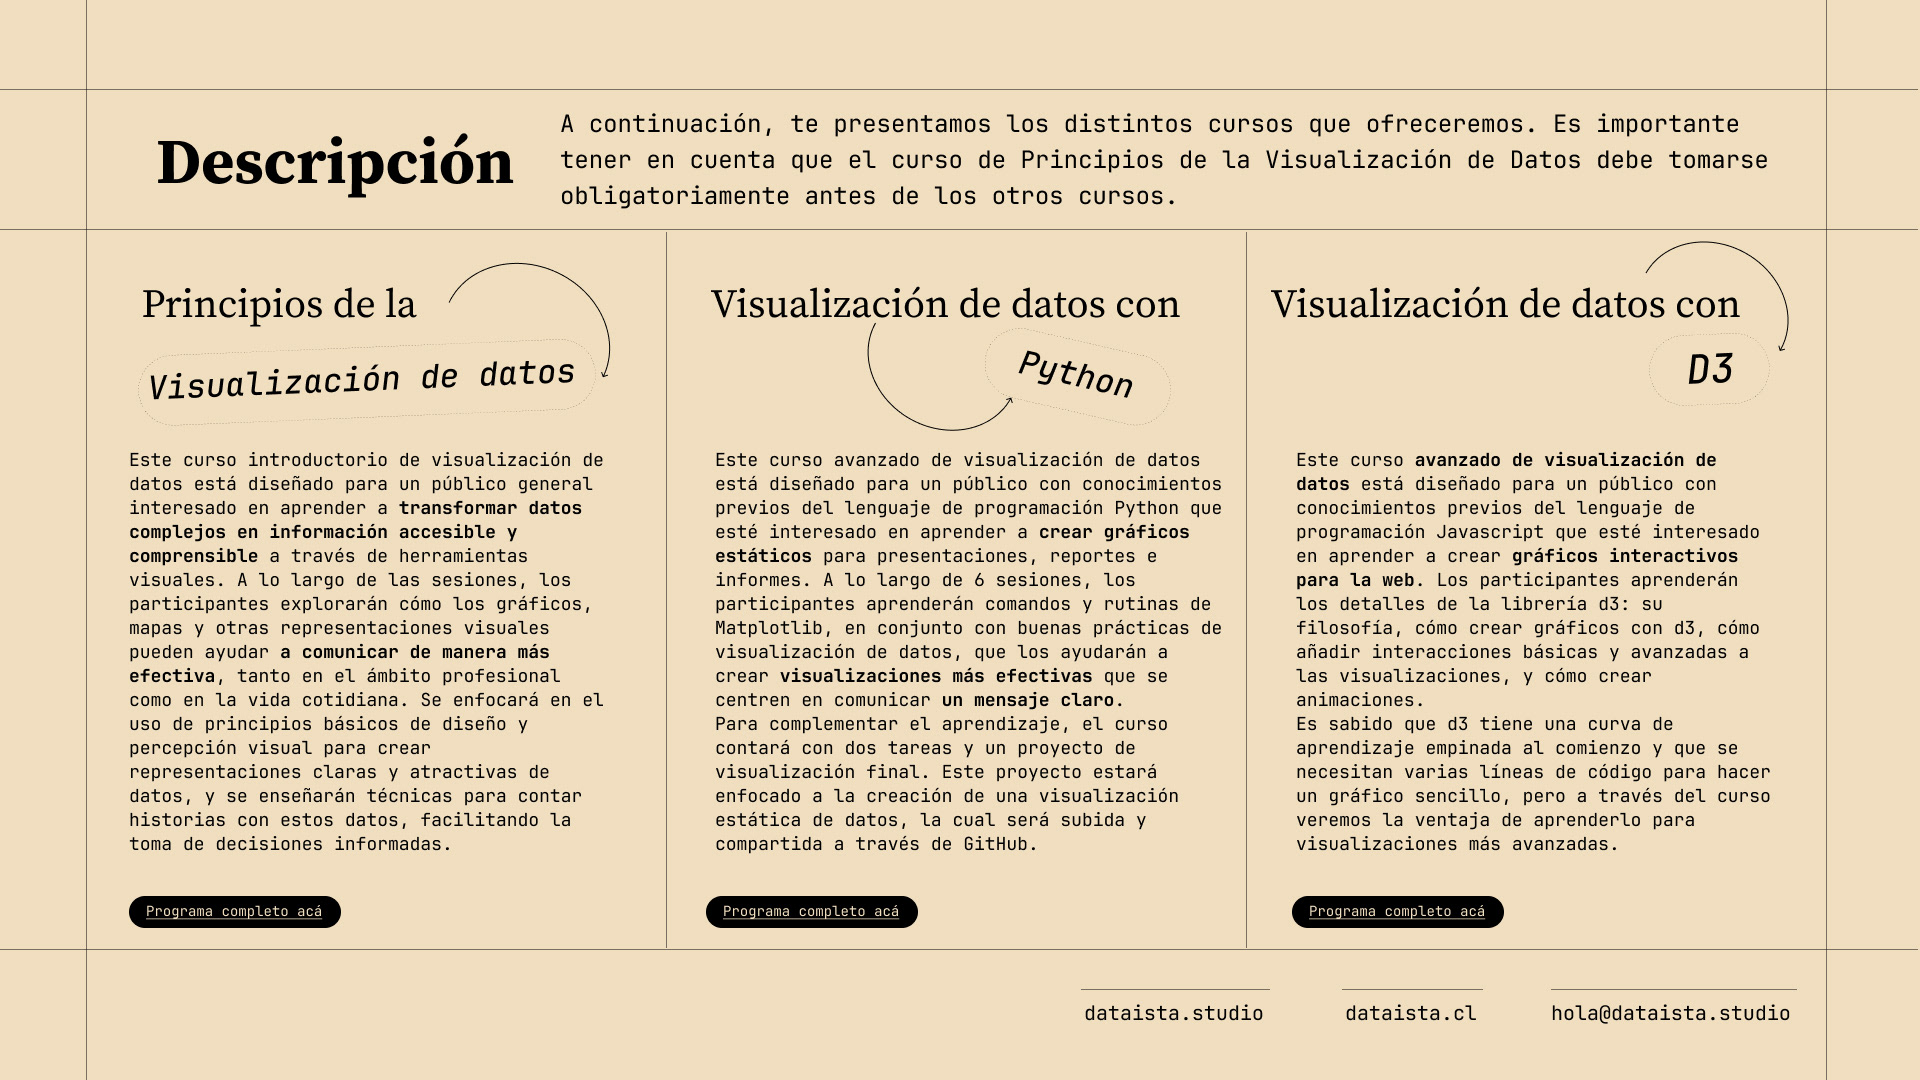
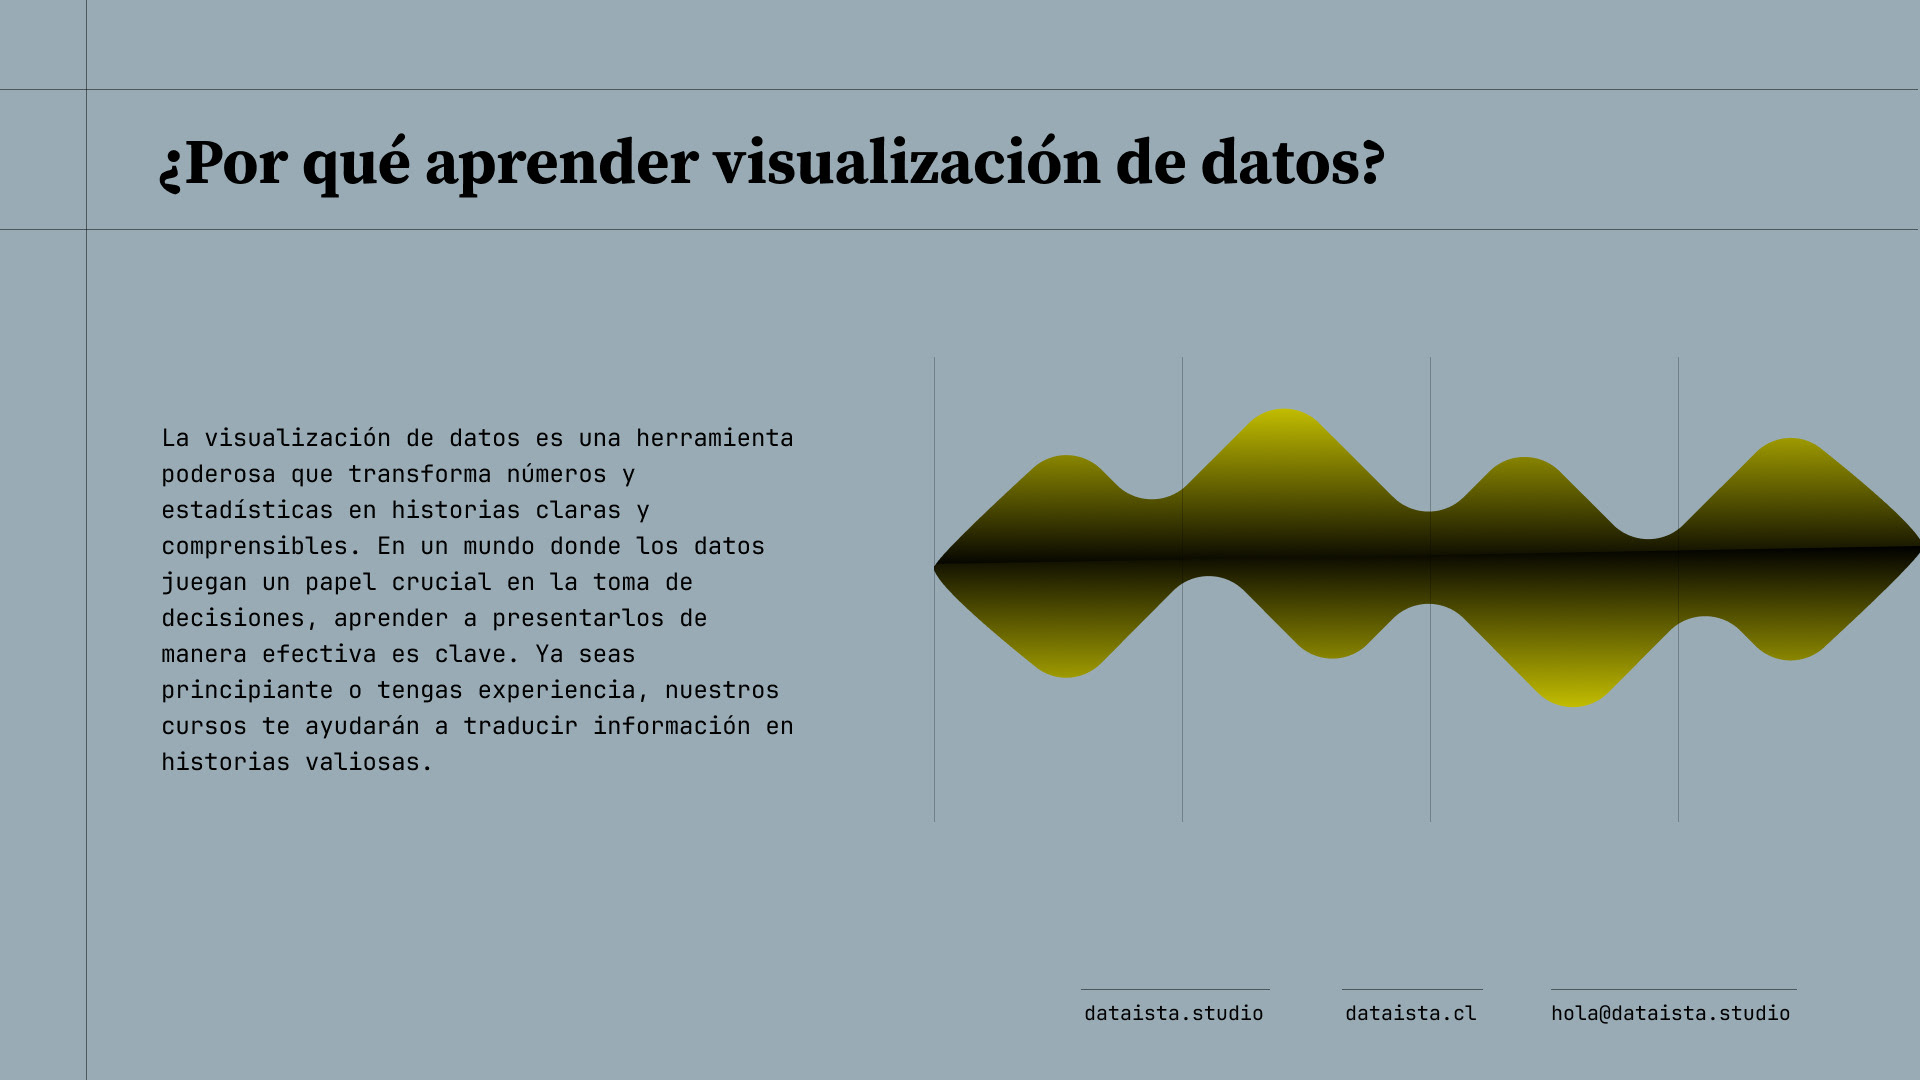
Presentations
Social media posts


Brand guidelines